library(tidyverse)
data(iris)

iris %>%
  ggplot(aes(x = Sepal.Length, y = Petal.Length, fill = Species))+
  geom_smooth(method = "lm", se = F, aes(col = Species))+
  geom_point(shape = 21, size = 2)+
  theme_classic()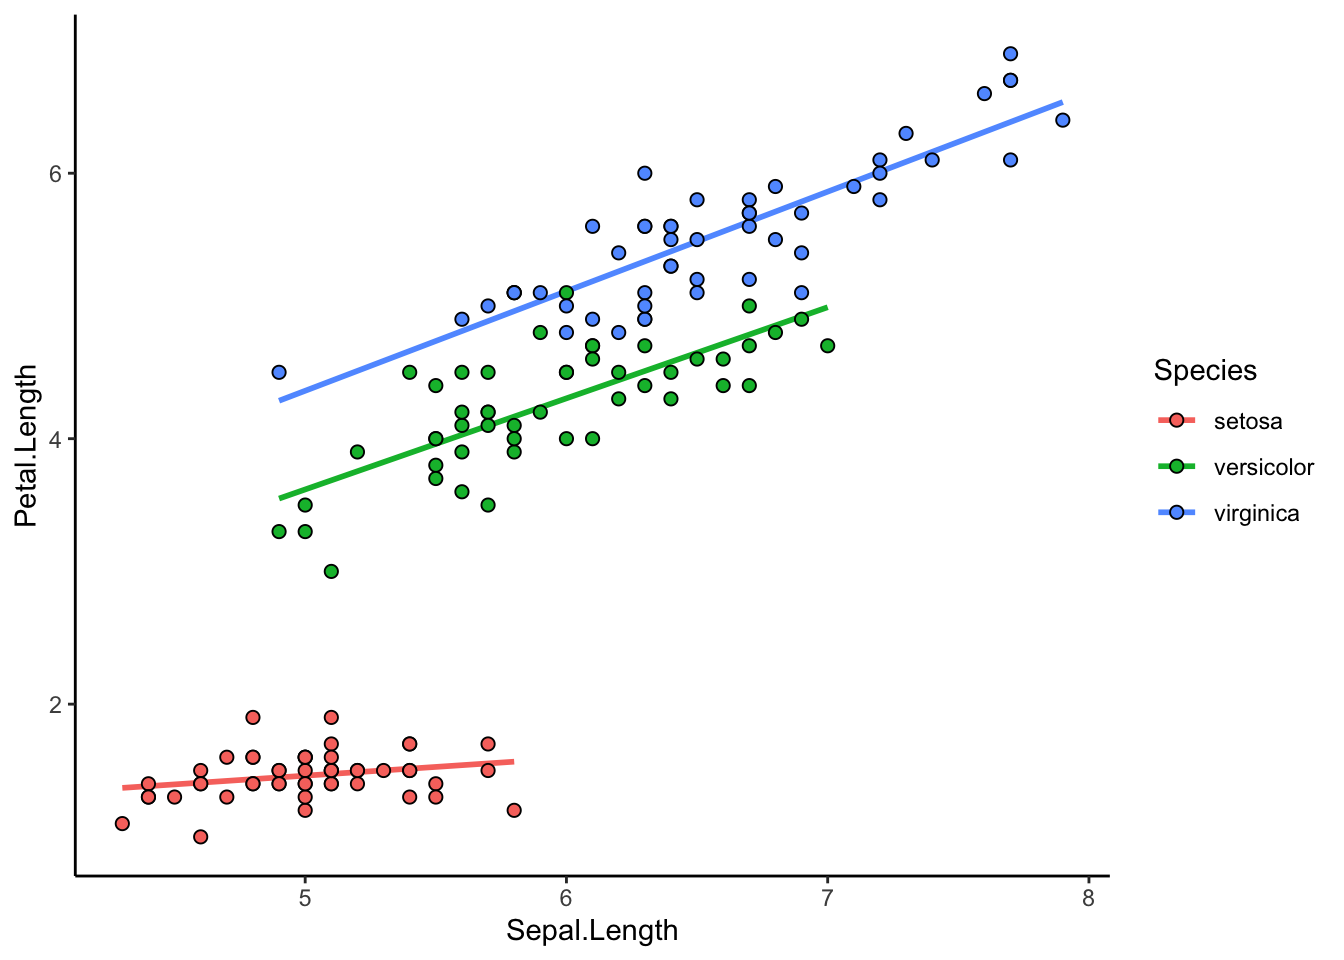
Plot iris dataset
library(tidyverse)
data(iris)
iris %>%
ggplot(aes(x = Sepal.Length, y = Petal.Length, fill = Species))+
geom_smooth(method = "lm", se = F, aes(col = Species))+
geom_point(shape = 21, size = 2)+
theme_classic()
And show the first 10 rows
library(gt)
library(gtExtras)

iris %>%
  head(10) %>%
  gt() %>%
gt_theme_pff()| Sepal.Length | Sepal.Width | Petal.Length | Petal.Width | Species |
|---|---|---|---|---|
| 5.1 | 3.5 | 1.4 | 0.2 | setosa |
| 4.9 | 3.0 | 1.4 | 0.2 | setosa |
| 4.7 | 3.2 | 1.3 | 0.2 | setosa |
| 4.6 | 3.1 | 1.5 | 0.2 | setosa |
| 5.0 | 3.6 | 1.4 | 0.2 | setosa |
| 5.4 | 3.9 | 1.7 | 0.4 | setosa |
| 4.6 | 3.4 | 1.4 | 0.3 | setosa |
| 5.0 | 3.4 | 1.5 | 0.2 | setosa |
| 4.4 | 2.9 | 1.4 | 0.2 | setosa |
| 4.9 | 3.1 | 1.5 | 0.1 | setosa |