TP: Environmental Risk
Work Sheet 1
Task 1.2
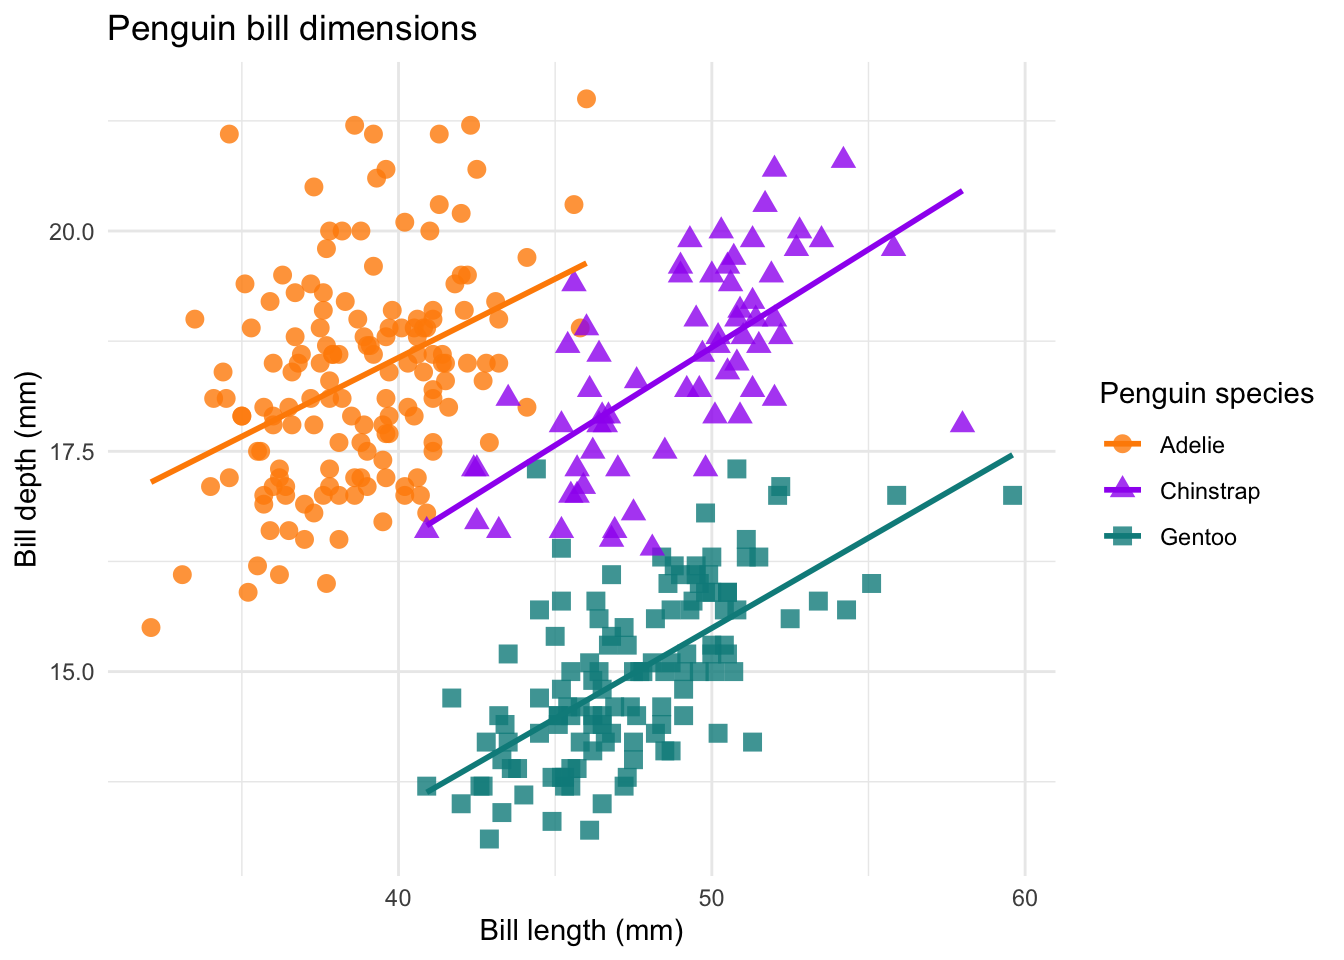
Take the palmerpenguins data set (saved as dat_penguins) and make a similar plot:
1   ggplot(data = ______,
2          aes(x = ______,
              y = ______,
3              col = ______)) +
4  geom_point(aes(shape = ______),
5             size = 3,
6             alpha = 0.8) +
7  geom_smooth(method = "lm", se = FALSE) +
8  scale_color_manual(values = c("darkorange","purple","cyan4")) +
9  labs(title = ______,
       x = ______,
       y = ______) +
10 theme_minimal()- 1
-
Take the
dat_penguinsdata set, and then, - 2
-
Use
bill_length_mmas x andbill_depth_mmas y axis - 3
- Use different colors for the different species
- 4
- Add a point layer, use different point shapes for the different species
- 5
- Define point size
- 6
- and transparency
- 7
-
Add lines through the point clouds for each species (takes
col = speciesfrom the 2 - 8
- Define a manual color scale
- 9
- Define the title, x, y axes, and a name for the colour legend
- 10
- Add a theme
Use the filter() function from dplyr:
1  ggplot(data = dat_penguins,
2          aes(x = bill_length_mm,
              y = bill_depth_mm,
3              col = species)) +
4  geom_point(aes(shape = species),
5             size = 3,
6             alpha = 0.8) +
7  geom_smooth(method = "lm", se = FALSE) +
8  scale_color_manual(values = c("darkorange","purple","cyan4")) +
9  labs(title = "Penguin bill dimensions",
       x = "Bill length (mm)",
       y = "Bill depth (mm)",
       color = "Penguin species",
       shape = "Penguin species") +
10 theme_minimal()- 1
-
Take the
dat_penguinsdata set, and then, - 2
-
Use
bill_length_mmas x andbill_depth_mmas y axis - 3
- Use different colors for the different species
- 4
- Add a point layer, use different point shapes for the different species
- 5
- Define point size
- 6
- and transparency
- 7
-
Add lines through the point clouds for each species (takes
col = speciesfrom the 2 - 8
- Define a manual color scale
- 9
- Define the title, x, y axes, and a name for the color legend
- 10
- Add a theme
Task 1.3
Calculate the mean, standard deviation (sd()), and replicates (n()) of body_mass_gfor the different species and sexes in dat_penguins.
Task 1.4
Take the dat_penguins data and
- calculate the mean
body_mass_gperyearandspecies - change the format from long to wide, year should be distributed across columns
1dat_penguins %>%
2  group_by(______, ______) %>%
3  summarise(______ = mean(______)) %>%
4  pivot_wider(names_from = ______,
5 values_from = ______)- 1
-
Take the
dat_penguinsdata - 2
-
Group it by
speciesandyear - 3
-
Calculate the
mean()ofbody_mass_g - 4
-
Transform into a wide data frame, take the column names from
year - 5
-
and the values from the mean
body_mass_g
1dat_penguins %>%
2  group_by(species, year) %>%
3  summarise(mean_body_mass_g = mean(body_mass_g)) %>%
4  pivot_wider(names_from = year,
5 values_from = mean_body_mass_g)- 1
-
Take the
dat_penguinsdata - 2
-
Group it by
speciesandyear - 3
-
Calculate the
mean()ofbody_mass_g - 4
-
Transform into a wide data frame, take the column names from
year - 5
-
and the values from
mean_body_mass_g
Task 1.4 Bonus
Why are there NA values and how can you avoid it?
Have a look at the actual data:
dat_penguinsThe data contains NA values. Since these values are not known, R cannot calculate a mean for groups containing NA values. To ignore NA values, set na.rm = TRUE in the mean() function:
dat_penguins %>%
  group_by(species, year) %>%
  summarise(mean_body_mass_g = mean(body_mass_g, na.rm = TRUE)) %>%
  pivot_wider(names_from = year,
  values_from = mean_body_mass_g)